Pontok összevonása
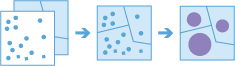
Ez az eszköz egy pontszerű vektoros elemeket tartalmazó réteggel és egy terület vektoros elemeket tartalmazó réteggel működik. A bemeneti terület vektoros elemek származhatnak poligonrétegből, de származhatnak négyszög vagy hatszög alakú gyűjtőkből is az eszköz futtatásakor. Az eszköz először meghatározza, hogy mely pontok esnek az egyes megadott területeken belül. A pont-terület térbeli kapcsolat meghatározása után kiszámítja a területen található összes ponttal kapcsolatos statisztikai adatokat, és hozzárendeli őket a területhez. A legalapvetőbb statisztikai adat a területen belüli pontok száma, de más statisztikai adatok kinyerésére is lehetőség van.
Tegyük fel például, hogy rendelkezésre állnak kávézók helyének pontszerű vektoros elemei és megyék terület vektoros elemei, és szeretné megyénként összesíteni a kávéértékesítést. Feltételezve azt, hogy a kávézók rendelkeznek TOTAL_SALES attribútummal, kinyerheti a megyénkénti TOTAL_SALES összegét vagy a megyénkénti minimális vagy maximális TOTAL_SALES értékét, vagy más statisztikákat, például a darabszámot, a terjedelmet, a szórást és a varianciát.
Ez az eszköz időbélyeggel ellátott adatokkal is képes működni. Ha az idő engedélyezve van a bemeneti pontokon, akkor rendelkezésre áll az időszeletek képzése lehetőség. Időszeletek képzésével lehetősége van a pont-terület kapcsolat kiszámítására egy meghatározott időszeletet figyelve. Nézhet például órás időintervallumot, amikor is minden órában kapna egy kimenetet eredményképpen.
Az idő használatára példaként tegyük fel, hogy a különböző kávézókban végbement tranzakciók mindegyikéről rendelkezésre állnak pontszerű vektoros elemek, és nincs területréteg. Az adatokat egy éve gyűjtik, és mindegyik tranzakcióhoz hely és időbélyegző tartozik. Feltételezve, hogy mindegyik tranzakció rendelkezik TOTAL_SALES attribútummal, kiszámíthatja az összes TOTAL_SALES összegét az Önt érdeklő helyen és időben. Ha ezek a tranzakciók mind egy városból valók, létrehozhatunk 1 kilométeres rácshálóknak megfelelő területeket, és heti időszeletekben nézhetjük az adatokat a tranzakciók időbeli és térbeli összegzéséhez.
A területekké összesíteni kívánt pontokat tartalmazó réteg kiválasztása
A pontréteg, amelyet a program területekké összesít. A Négyszög vagy Hatszög gyűjtőkké összesített pontrétegeknél alkalmazott térbeli referenciát vetületi koordináta-rendszerre kell állítani az Elemzési környezetek segítségével.
In addition to choosing a layer from your map, you can choose Browse Layers at the bottom of the drop-down list to browse to your contents for a big data file share dataset or feature layer.
Válassza ki a területréteget, amelybe az összevonás történik
A terület, amelybe a pontréteg összesítve lesz. Választhat a megadott terület réteg vagy az eszköz futásakor létrehozott tárolók között. Négyszög tárolók létrehozásakor a megadott szám és egységek a négyszög magasságát és hosszúságát határozzák meg. Hatszög esetén a megadott szám és a mértékegységek a párhuzamos oldalak közötti távolságot határozzák meg.
Analysis using Square or Hexagon bins requires a projected coordinate system. You can set the Processing coordinate system in Analysis Environments. If your processing coordinate system is not set to a projected coordinate system, you will be prompted to set it when you Run Analysis .
Válassza ki azt a területréteget, amelybe az összevonás történik
A területréteg, amelybe a program összesíti a pontokat. A program az ezen a rétegen található területek határvonalain belül eső bármely pontot számba veszi, és opcionálisan összesíti a felhasználó által kiválasztott statisztika használatával.
Either Bin Size for bins or Area Layer must be set.
Válassza ki a távolságot a gyűjtők létrehozásához és az összevonáshoz
Azoknak a gyűjtőknek a létrehozásához használt távolság, amelybe a bemenő pontokat összesíti. Négyszög alakú gyűjtő esetén a méret a négyszög magasságát jelöli. Hatszög alakú gyűjtő esetén a méret a hatszög (párhuzamos oldalaktól mért) magasságát jelöli.
Either Bin Size for bins or Area Layer must be set.
Összevonás időbeli lépések használatával (opcionális)
If time is enabled on the input point layer and it is of type instant, you can analyze using time stepping. There are three parameters you can set when you use time:
- Time step interval
- How often to repeat the time step
- Time to align the time steps to
For example, if you have data that represents a year in time and you want to analyze it using weekly steps, set Time step interval to 1 week.
For example, if you have data that represents a year in time and you want to analyze it using the first week of the month, set Time step interval to 1 week, How often to repeat the time step to 1 month, and Time to align the time steps to to January 1, at 12:00 am.
Időbeli lépés intervalluma
The interval of time used for generating time steps. Time step interval can be used alone or with the How often to repeat the time step or Time to align the time steps to parameter.
For example, if you want to create time steps that take place every Monday from 9:00 a.m. until 10:00 a.m., set Time step interval to 1 hour, How often to repeat the time step to 1 week, and Time to align the time steps to to 9:00:00 a.m. on a Monday.
Az időbeli lépés ismétlésének gyakorisága
The step used for calculating a time step. How often to repeat the time step can be used alone, with Time step interval, with Reference Time, or with both Time step interval and Time to align the time steps to.
For example, if you want to create time steps that take place every Monday from 9:00 a.m. until 10:00 a.m., set Time step interval to 1 hour, How often to repeat the time step to 1 week, and Time to align the time steps to to 9:00:00 a.m. on a Monday.
Az időbeli lépések igazításához használt idő
The date and time used to align time slicing. Time stepping will start at and continue backward from this time. If no reference time is selected, time stepping will align to January 1st, 1970.
For example, if you want to create time steps that take place every Monday from 9:00 a.m. until 10:00 a.m., set Time step interval to 1 hour, How often to repeat the time step to 1 week, and Time to align the time steps to to 9:00:00 a.m. on a Monday.
Statisztika hozzáadása (opcionális)
You can calculate statistics on features that are summarized. You can calculate the following on numeric fields:
- Count—Calculates the number of nonnull values. It can be used on numeric fields or strings. The count of [null, 0, 2] is 2.
- Sum—The sum of numeric values in a field. The sum of [null, null, 3] is 3.
- Mean—The mean of numeric values. The mean of [0, 2, null] is 1.
- Min—The minimum value of a numeric field. The minimum of [0, 2, null] is 0.
- Max—The maximum value of a numeric field. The maximum value of [0, 2, null] is 2.
- Range—The range of a numeric field. This is calculated as the minimum values subtracted from the maximum value. The range of [0, null, 1] is 1. The range of [null, 4] is 0.
- Variance—The variance of a numeric field in a track. The variance of [1] is null. The variance of [null, 1,0,1,1] is 0.25.
- Standard deviation—The standard deviation of a numeric field. The standard deviation of [1] is null. The standard deviation of [null, 1,0,1,1] is 0.5.
You can calculate the following on string fields:
- Count—The number of nonnull strings.
- Any—This statistic is a random sample of a string value in the specified field.
SpatialReference (WKID)
This is a temporary parameter for prerelease to set the processing spatial reference. Many big data tools require that a projected coordinate system is used as the spatial reference for processing. By default, the tool will use the input coordinate system but will fail if it's a geographic coordinate system. To set a projected coordinate system, enter the WKID. For example, Web Mercator would be entered as 3857.
ArcGIS Data Store adattár kiválasztása az eredmények mentéséhez
GeoAnalytics results are stored to an ArcGIS Data Store and exposed as a feature layer in Portal for ArcGIS. In most cases, results should be stored to the spatiotemporal data store and this is the default. In some cases, saving results to the relational data store is a good option. The following are reasons why you may want to store results to the relational data store:
- You can use results in portal-to-portal collaboration.
- You can enable sync capabilities with your results.
You should not use the relational data store if you expect your GeoAnalytics results to increase and need to take advantage of the spatiotemporal big data store's capabilities to handle large amounts of data.
Eredmény réteg neve
The name of the layer that will be created in My Content and added to the map. Az alapértelmezett név az eszköz nevétől és a bemenő réteg nevétől függ. If the layer already exists, the tool will fail.
Az Eredmény mentési helye legördülő mezőben megadhatja a Saját tartalom mappájának nevét, ahová az eszköz menti az eredményt.