GeoAnalytics distributes the analytics work across your ArcGIS GeoAnalytics Server. This allows you to analyze more data faster by harnessing the power of multiple machines. The following tools are currently available:
- Aggregate Points
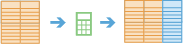
- Build Multi-Variable Grid
- Join Features
- Reconstruct Tracks
- Summarize Attributes
- Summarize Within
- Geocode Locations from Table
- Detect Incidents
- Find Similar Locations
- Calculate Density
- Find Point Clusters
- Find Hot Spots
- Create Buffers
- Append Data
- Calculate Field
- Copy to Data Store
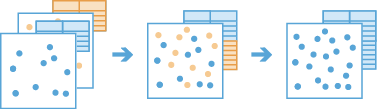
- Overlay Layers
GeoAnalytics focuses on analyzing large data with an emphasis on both spatial and temporal patterns.
Summarize Data
The Summarize Data toolset contains tools that calculate total counts, lengths, areas, and basic descriptive statistics of features and their attributes within areas or near other features.
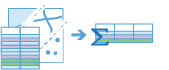
- Aggregate Points calculates statistics about points that fall within specified areas or bins.
- Build Multi-Variable Grid generates a grid of square or hexagonal bins and calculates values for each bin based on the proximity of each input layer.
- Join Features calculates statistics about features that share a spatial, temporal, or attribute relationship with other features.
- Reconstruct Tracks calculates statistics about points or polygons that belong to the same track and reconstructs inputs into tracks.
- Summarize Attributes calculates statistics about feature or tabular data that share attributes.
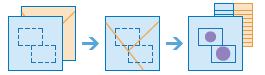
- Summarize Within calculates statistics for area features and attributes that overlap each other.
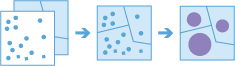
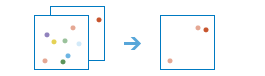
Aggregate Points |
|
Using a layer of point features and either a layer of area features or bins defined by a specified distance, this tool determines which points fall within each area or bin and calculates statistics about all the points within each area or bin. You may optionally apply time slicing with this tool.
The following are examples:
- Given point locations of crime incidents, count the number of crimes per county or other administrative district.
- Find the highest and lowest monthly revenues for franchise locations using 100-kilometer bins.
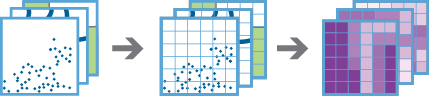
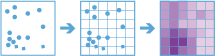
Build Multi-Variable Grid |
|
The Build Multi-Variable Grid tool generates a grid of square or hexagonal bins and calculates variables for each bin based on the proximity of one or more input layers.
The following are examples:
- Given multiple layers of public transportation infrastructure, what part of the city is least accessible by public transportation?
- Given layers of waterways, such as lakes and rivers, what is the name of the water body closest to each location in the U.S.?
- Given a layer of household income, where in the U.S. is the variation of income in the surrounding 50 miles the greatest?
Join Features |
|
Using either feature layers or tabular data, you can join features and records based on specific relationships between the input layers or tables. Joins will be determined by spatial, temporal, and attribute relationships, and summary statistics can be optionally calculated.
The following are examples:
- Given point locations of crime incidents with a time, join the crime data to itself specifying a spatial relationship of crimes within 1 kilometer of each other and that occurred within 1 hour of each other to determine if there are a sequence of crimes close to each other in space and time.
- Given a table of ZIP Codes with demographic information and area features representing residential buildings, join the demographic information to the residences so each residence now has the information.
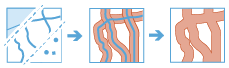
Reconstruct Tracks |
|
Using a time-enabled layer of
point or polygon features that represent an instant in time, this tool
determines which input features belong in a track and will order the inputs sequentially in time. Statistics are optionally calculated for the input features within each track.
The following are examples:
- Given point locations and time of hurricane measurements, calculate the mean wind speed and max wind pressure of the hurricane.
- Use GPS measurements of ships, to reconstruct ship paths as lines.
Summarize Attributes |
|
Using either feature or tabular data, this tool summarizes statistics for specified fields.
The following are examples:
- Given locations of grocery stores with a field COMPANY_NAME, summarize the stores by the company name to determine statistics for each company.
- Given a table of grocery stores with fields COMPANY_NAME and COUNTY, summarize the stores by the company name and county to determine statistics for each company within each county.
Summarize Within |
|
Finds areas (and portions of areas) that overlap between two layers and calculates statistics about the overlap.
The following are examples:
- Given a layer of watershed areas and a layer of land-use areas by land-use type, calculate total acreage of land-use type for each watershed.
- Given a layer of parcels in a county and a layer of city boundaries, summarize the average value of vacant parcels within each city.
Find Locations
These tools are used to identify areas that meet a number of different criteria you specify.
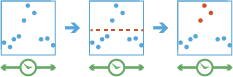
- Detect Incidents works with time-enabled layers to determine which features meet a specified condition.
- Geocode Locations from Table converts addresses into coordinates.
- Find Similar Locations finds locations most similar to one or more reference locations based on criteria you specify.
Detect Incidents |
|
This tool works with a time-enabled layer of points, lines, areas, or tables that represents an instant in time. Using sequentially ordered features, called tracks, this tool determines which features are incidents of interest. Incidents are determined by conditions that you specify.
The following are examples:
- Detect hurricane measurements that are Category 4 hurricanes based on a wind speed attribute.
- Using GPS measurements of ship movement with a field representing the ship speed, find measurements that are greater than 1.5 times the mean of the previous five measurements.
Geocode Locations from Table |
|
Converts addresses into coordinates. Use this tool on big data file share tables.
Find Similar Locations |
|
Based on criteria you specify, find similar locations by measuring the similarity of locations in your candidate search layer to one or more reference locations.
The following are examples:
- Find the ten most similar stores by examining the number of employees and the annual sales.
- Find the 100 most similar cities by examining the relationship between population, annual growth, and tax revenue.
Analyze Patterns
These tools help you identify, quantify, and visualize spatial patterns in your data.
- Calculate Density takes known quantities of some phenomenon and spreads these quantities across the map.
- Find Hot Spots identifies statistically significant clustering in the spatial pattern of your data.
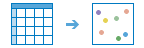
- Find Point Clusters finds clusters of point features in surrounding noise based on their spatial distribution.
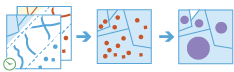
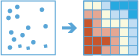
Calculate Density |
|
The Calculate Density tool creates a density map from point features by spreading known quantities of some phenomenon (represented as attributes of the points) across the map. The result is a layer of areas representing the density.
The following are examples:
- Calculating densities of hospitals within a county. The result layer will show areas with high and low accessibility to hospitals, and this information can be used to decide where new hospitals should be built.
- Identifying areas that are at high risk of forest fires based on historical locations of forest fires.
- Locating communities that are far from major highways in order to plan where new roads should be constructed.
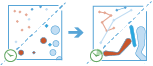
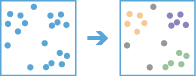
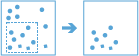
Find Point Clusters |
|
The Find Point Clusters tool finds clusters of point features in surrounding noise based on their spatial distribution.
The following are examples:
- Find clusters of pest-infested households to help target eradication efforts.
- Inform and act on rescue and evacuation needs based on the size and location of the clusters using geolocated tweets following natural hazards or terror attacks.
Find Hot Spots |
|
The Find Hot Spots tool will determine if there is any statistically significant clustering in the spatial pattern of your data.
- Are your points (crime incidents, trees, traffic accidents) really clustered? How can you be sure?
- Have you truly discovered a statistically significant hot spot (for spending, infant mortality, consistently high test scores) or would your map tell a different story if you changed the way it was symbolized?
Use Proximity
These tools help answer one of the most common questions posed in spatial analysis: What is near what?
- Create Buffers creates areas of a specified distance from features.
Create Buffers |
|
A buffer is an area that covers a given distance from a point, line, or polygon feature.
The following are examples:
- Using linear river features, buffer each river by 50 times the width of the river to determine a proposed riparian boundary.
- Given areas representing countries, buffer each country by 200 nautical miles to determine the maritime boundary.
Manage Data
These tools are used for the day-to-day management of geographic and tabular data.
- Append Data appends features to an existing hosted feature layer.
- Calculate Field creates a new field or modifies an existing field and creates a new layer in your contents.
- Copy to Data Store copies data to your ArcGIS Data Store and creates a layer in your contents.
- Overlay Layers combines two or more layers into a single layer.
Copy to Data Store |
|
Copies an input feature layer or table to an ArcGIS Data Store and creates a layer in your contents in ArcGIS Enterprise.
The following are examples:
- Copy a collection of
.csvfiles in a big data file share to the spatiotemporal data store for visualization. - Copy the features in the current map extent that are stored in the spatiotemporal data store to the relational data store.
Calculate Field |
|
Calculates values for a new or existing field and creates a layer in your contents in ArcGIS Enterprise.
The following are examples:
- Modify an existing field named total to be the sum of revenue from fields total_2016, total_2017, and total_2018.
- Create a new field to categorize hazard levels based on field values such as windspeed and pollutant.
Overlay Layers |
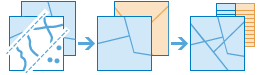
|
Overlay combines two or more layers into one single layer. Overlay is used to answer one of the most basic questions of geography, What is on top of what? The following are examples:
- What parcels are within the 100-year flood plain? (Within is just another way of saying on top of.)
- What land use is on top of what soil type?
- What wells are within abandoned military bases?
Append Data |
|
Appends features to an existing hosted layer in your contents in ArcGIS Enterprise.
The following are examples:
- Update your 2018_Sales feature layer each month as your reports become available.
- Append hurricane tracking datasets from the years 2016 and 2017 into a master hurricane dataset.
- Collect and append datasets from various sources with different schemas using custom field mapping.