Dissolve Boundaries
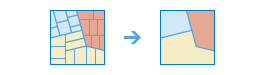
Areas that overlap or share a common boundary or attribute value are merged together to form a single area.
You can control which boundaries are merged by specifying a field. For example, if you have a layer of counties, and each county has a State_Name attribute, you can dissolve boundaries using the State_Name attribute. Counties will be merged together if they have the same value for State_Name. The end result is a layer of state boundaries.
Choose area layer whose boundaries will be dissolved
The layer containing area features that will be dissolved.
In addition to choosing a layer from your map, you can choose Browse Layers at the bottom of the drop-down list to browse to your contents for a big data file share dataset or feature layer.
Choose dissolve method
You can choose one of two methods for merging area features:
- Areas that overlap or are adjacent—Two or more areas whose boundaries overlap each other will be merged into one area. In addition, areas that are adjacent (that is, they share a common boundary) will be merged into one area.
- Areas with the same field value—Areas will be merged into one area if they have the same field value.
Allow multipart features
Multipart is a representation of a place or thing that has more than one part but is defined as one feature because it references one set of attributes. In a layer of states, for example, the state of Hawaii could be considered a multipart feature because its separate geometric parts are classified as a single state.
Allow multipart features offers two options:
- True (checked)— the output service can contain multipart features.
- False (unchecked)— the output service will only contain single-part features, and individual features will be created for each part. This is the default.
Add statistics (optional)
When areas are merged, you can summarize their attribute values with meaningful statistics. For example, if you are dissolving the boundary between counties based on State_Name, and each county has a Population field, you could calculate the sum of Population for the state.
You can calculate statistics on features that are summarized. You can calculate the following on numeric fields:
- Count—Calculates the number of nonnull values. It can be used on numeric fields or strings. The count of [null, 0, 2] is 2.
- Sum—The sum of numeric values in a field. The sum of [null, null, 3] is 3.
- Mean—The mean of numeric values. The mean of [0, 2, null] is 1.
- Min—The minimum value of a numeric field. The minimum of [0, 2, null] is 0.
- Max—The maximum value of a numeric field. The maximum value of [0, 2, null] is 2.
- Range—The range of a numeric field. This is calculated as the minimum values subtracted from the maximum value. The range of [0, null, 1] is 1. The range of [null, 4] is 0.
- Variance—The variance of a numeric field in a track. The variance of [1] is null. The variance of [null, 1,0,1,1] is 0.25.
- Standard deviation—The standard deviation of a numeric field. The standard deviation of [1] is null. The standard deviation of [null, 1,0,1,1] is 0.5.
You can calculate the following on string fields:
- Count—The number of nonnull strings.
- Any—This statistic is a random sample of a string value in the specified field.
Result layer name
The name of the layer that will be created in My Content and added to the map. The default name is based on the tool name and the input layer name. If the layer already exists, the tool will fail.
Using the Save result in drop-down box, you can specify the name of a folder in My Content where the result will be saved.