Raster analysis allows you to perform analysis of large raster datasets using the ArcGIS Image Server. This allows you to analyze more data faster by harnessing the power of the server. The toolsets currently available through the Portal for ArcGIS web user experience are Summarize Data, Analyze Patterns, Analyze Image, Analyze Terrain, and Manage Data.
Summarize Data
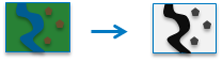
This toolset contains a tool for calculating some statistics for a raster layer within area boundaries that you define.
- Summarize Raster Within calculates statistics for raster cells that fall within defined area boundaries.
Summarize Raster Within |
|
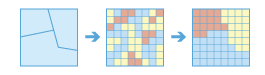
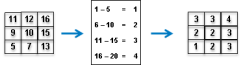
Calculates some summary statistics for raster cells within defined areas.
Some example applications are the following:
- Given a layer of watershed areas and an elevation raster layer, calculate the range of elevations within each watershed in order to determine which ones will have the highest energy streamflow.
- Given a layer of administrative management units and a raster layer of land-use categories, calculate the variety of land-use values within each management area to identify which ones require the most work to determine a management plan.
Analyze Patterns
These tools help you identify, quantify, and visualize spatial patterns in your data.
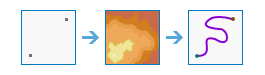
- Calculate Density takes known quantities of some phenomenon and creates a density map by spreading these quantities across the map.
- Interpolate Points predicts values at new locations based on measurements found in a collection of points.
Calculate Density |
|
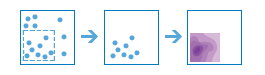
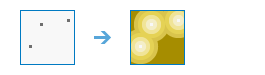
Density analysis takes known quantities of some phenomenon and creates a density map by spreading these quantities across the map. You can use this tool, for example, to show concentrations of lightning strikes or tornadoes, access to health care facilities, and population densities.
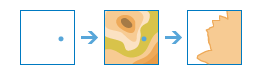
Interpolate Points |
|
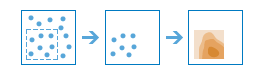
This tool allows you to predict values at new locations based on measurements found in a collection of points. The tool takes point data with values at each point and returns areas classified by predicted values. You can use this tool, for example, to predict rainfall levels across a watershed based on measurements taken at individual rain gauges.
Use Proximity
These tools help you answer one of the most common questions posed in spatial analysis: "What is near what?"
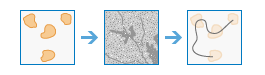
- Calculate Distance calculates the Euclidean distance, direction and allocation from a single or set of sources.
- Determine Optimum Travel Cost Network calculates the optimum cost network from a set of input regions.
- Determine Travel Cost Path As Polyline calculates the least cost polyline path between sources and known destinations.
Calculate Distance |
|
Calculates the Euclidean distance, direction and allocation from a single or set of sources. You can use this tool to determine how far a location is to a road, a building or a park. You can also determine which direction you must travel from a location to return back to a source in the most direct way. You can see for every location in your study area which is the closest source.
Determine Optimum Travel Cost Network |
|
Calculates the optimum cost network from a set of input regions.
Determine Travel Cost Path As Polyline |
|
Calculates the least cost polyline path between sources and known destinations.
Analyze Image
The following tool helps you analyze images.
- Apply Raster Function Template processes your imagery with the chain of functions, as specified by the raster function template.
- Monitor Vegetation detects vegetation within an image, based on arithmetic operations on the bands.
Apply Raster Function Template |
Processes your imagery with the chain of functions, as specified by the raster function template.
Monitor Vegetation |
|
Performs an arithmetic operation on the bands of a multiband raster layer to reveal vegetation coverage information of the study area.
Analyze Terrain
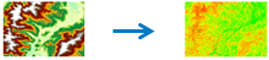
These tools help you analyze raster surfaces.
- Calculate Slope calculates the steepness of terrain.
- Derive Aspect calculates the direction of steepest slope for each location.
- Create Viewshed identifies what can be seen from any point on the landscape.
- Watershed calculates the contributing area above identified location(s) on a surface.
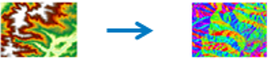
Calculate Slope |
|
Identifies a surface that shows the slope of the input elevation data. Slope represents the rate of change of elevation for each digital elevation model (DEM) cell.
Derive Aspect |
|
Identifies the downslope direction of the maximum rate of change in value from each cell to its neighbors. Aspect can be thought of as the slope direction.
Create Viewshed |
|
Determines the locations on a raster surface that are visible to a set of observers.
Watershed |
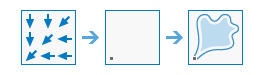
|
Determines the contributing area above a set of cells in a raster.
Manage Data
These tools are used for both the day-to-day management of geographic data and for combining data prior to analysis.
- Extract Raster clips out portions from a raster dataset for further analysis.
- Remap Values assigns different values to raster cells.
- Convert Feature to Raster rasterizes vector data.
- Convert Raster to Feature vectorizes raster data.
Extract Raster |
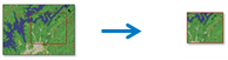
|
Extract cells from a raster based on value, shape, or the extent of a different dataset.
Remap Values |
|
Change the individual or ranges of cell values to new values.
Convert Feature to Raster |

|
Create a new raster dataset from an existing feature dataset.
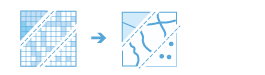
Convert Raster to Feature |
|
Create a new feature dataset from an existing raster dataset.